

Teen Depression is Rising, but What Does it Mean?
For the past several days, the Twitter Discourse has been about teen depression and its stratospheric increase. It’s smartphones! It’s letting teens be online at all! It’s that they don’t have fun anymore! Because of smartphones!
And indeed, there is a lot to be worried about in the most recent data on teenage emotional distress from the most recent Youth Risk Behavior Surveillance System data. It shows increasing levels of teenage emotional distress and high levels of self-reported poor mental health, which is a trend that is seen across several data sets and surveys. In this post, I will dig into the different data sources, see what the full picture of teenage distress and depression is, and posit some questions we need answered to find out what is driving this trend.
Some Background
I’m an avid reader of Twitter and consumer of Discourse. And I often find myself wanting to know more context around charts, graphs, and maps I see on Twitter. Sometimes I even do a stupidly deep dive into the data to see if I can somehow figure out what is going on instead of just watching the takes swirl.
Anyone who dives deep into data often knows that it rarely tells a clean story. And so my goal is to present the data behind the data - the deeper dive, that may raise more questions than it answers.
Youth Risk Behavior Survey
Derek Thompson discusses teen “anxiety” and sadness in a piece in The Atlantic. His analysis is based on the results of the 2021 Youth Risk Behavior Survey, which is administered to high school students and tracked by the CDC.
Thompson does not dig into the data himself, but his analysis is particularly focused on teen self-reported persistent sadness. This measure has increased substantially over the past decade, especially for girls, such that more than half (57%) of female high school students report persistent feelings of sadness or hopelessness in the past year.

Thompson also focuses on LGBQ youth statistics (trans youth are not identified separately in YBRS) and says that the situation is getting worse more rapidly for LGBQ-identified youth than heterosexual youth. However, this is not borne out in the data on suicidal behavior in this group. If anything, the situation has improved slightly since YBRS first started collecting self-identified sexual orientation data in 2015.

One important note about YBRS is that it is all based on self-report. This has led many people to suggest that decreased stigma and increased reporting is behind many of the trends we see. This is important to consider when relying on self-report data, which is more subject to reporting bias than more rigorous methods of determining distress and depression.
National Survey on Drug Use and Health
Today I saw several people QTing this post, asking whether the numbers were plausible or expressing shock at such a dramatic increase.

This graph comes from Jonathan Haidt’s Substack, where he is digging into the teen mental health crisis and possible causes. Haidt has a perspective, which is that smartphones and the decline of in-person interactions is driving a mental health crisis among youth.
I was pretty surprised when I saw that graph, and I dug into it. Turns out the data is correct, with one major caveat. The data comes from the National Survey on Drug Use and Health, which has a module that asks specifically about depressive symptoms and impairment. The data is publicly available, but it’s year by year so it’s a pain in the ass to trend over time. The sample is adolescents ages 12 to 17.
The big caveat here is there was a methodology change between 2019 and 2020 and beyond. In fact, the data access page says “Data from 2020 and/or 2021 should not be pooled or compared with prior years.” This is a big difference, because a third of the increase shown in Haidt’s graph comes from 2020 and 2021.

Nevertheless, there is an alarming upward trend. The data above is for both sexes combined. From 2010 to 2019 (ten year trend) we see a 96% increase in adolescents with major depressive episodes and a 95% increase in MDE with severe impairment. So all told, a doubling of depression in the ten years from 2010 to 2019.
Another important point here is that this is depression as determined by a structured survey interview that asks about symptoms and then assigns a diagnosis, rather than depression as determined by asking someone if they have been diagnosed with depression. That means that this measure should be unaffected by changes in help-seeking and diagnosis practices. It is, however, still affected by people’s propensity to respond affirmatively to questions about depression.
Depression is a disease of the young
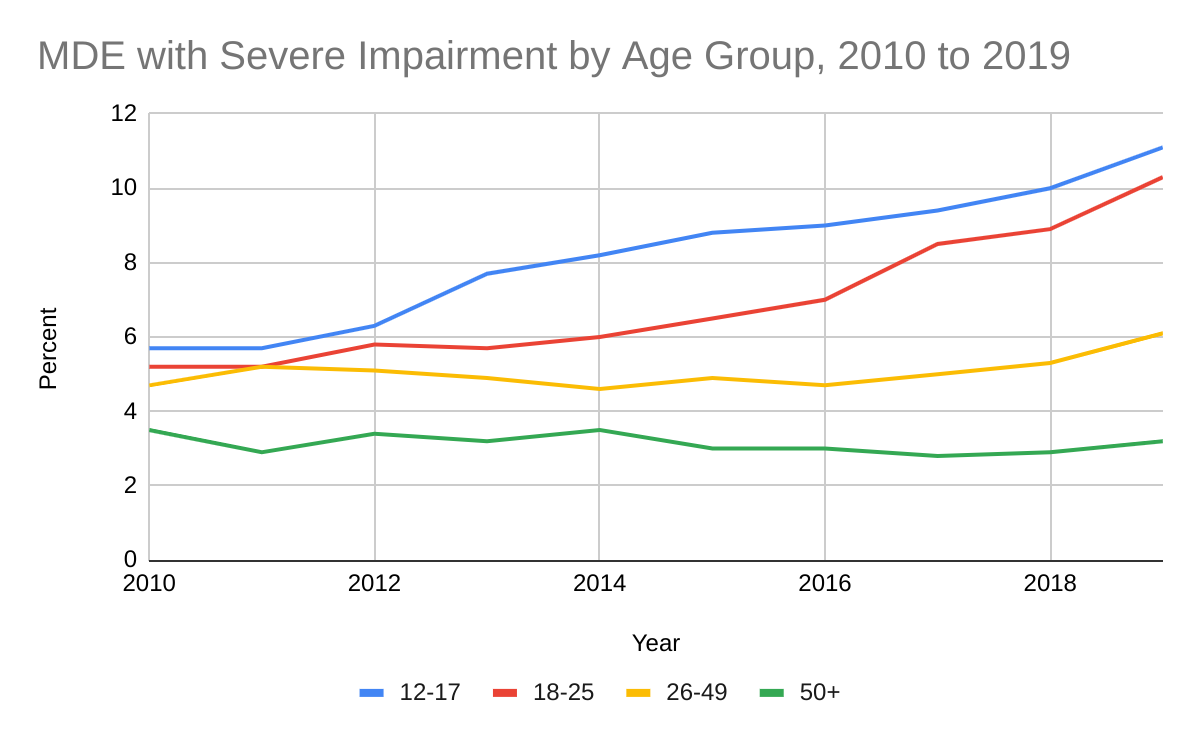
One interesting point is that NSDUH breaks out these numbers by age for major depressive episodes with severe impairment. As far as I can tell the adolescent and adult numbers are calculated the same way and are comparable. When broken down by age, we see that adolescents (12-17) have the highest rates of severe major depression, followed by young adults (18-25), then 26 to 49 year-olds, and finally older adults (50+). The increase over time is steeper for adolescents and young adults than it is for those 26 to 49, and adults over 50 have not had an increase in depression over the ten year period.
This is an important data point for those who think there is something unique about the experience of Zoomers and younger Millennials with regard to mental health, because it points to something that is different for these age groups compared to older age cohorts.
Teenage Suicidal Behavior and Suicide Rates
One more way to get at the question of how much depression is increasing is to look at suicidal behavior and rates for completed suicide.
Suicidal behavior is self-reported as part of the YBRS. There are four measures that deal with suicide:
Seriously Considered Attempting Suicide in the Past Year
Made a Suicide Plan during the Past Year
Attempted Suicide during the Past Year
Injured in a Suicide Attempt during the Past Year

Statistically significant changes over the ten year period of 2011 to 2021 are shown as a red octagon, while no change is shown as a yellow diamond. Again, the picture is a bit bleaker for females than for males. While both female and male high school students have an increased chance of seriously considering suicide, only female students are more likely to have made a suicide plan or attempted suicide in 2021 than in 2011. And for the most serious question, which is if you were injured in a suicide attempt, there has been no change for either sex over the past 10 years.
It is worth noting that this data does not sync up with NSDUH very well, which asks about both thoughts of suicide and suicide attempts in the past year. However, it only asks these questions to those who have been identified as qualifying for the depression module by virtue of their previous answers. In that data set, only 1.6% of adolescents report suicidal thoughts and only 0.36% report a suicide attempt. Some of this discrepancy is due to the methodology of the survey, but it’s a very large difference in reported suicide attempts in particular. One possible extension of this work would be to look at emergency department data for intentional self-harm to try and triangulate the suicide attempt numbers.
Finally, we can look at actual suicide rates for adolescents over time. Depression is the most prominent risk factor for suicide, although every suicide is complex and multi-factorial. Still, suicide rates can be informative as an outcome measure and in relation to the self-reported suicidal behavior data. To look at recent data, I used the CDC’s WISQARS database, limited the analysis to suicide as the intent of death, and restricted the ages to 12 to 17. Here, we also see an increase, albeit a smaller increase than we see in earlier measures. From 2010 to the peak in 2017, youth suicide rates increased 81.8%, and from 2010 to 2020 is a 64.4% increase.

It is worth noting that the numbers of deaths represented by these data are fairly small, and slicing the data further produces unreliable estimates, which is why I don’t present the trends by sex. However, the male to female ratio of suicides over the period of 2010 to 2020 was 2.3 to 1 in the 12 to 17 age group. Despite much higher reported distress and suicide attempts in adolescent girls, boys complete suicide at much higher rates.
However, if we look further back, youth suicide rates are down from their high in the late 1980s and early 1990s. This is a different age grouping, but the trend is clear - high suicide rates in the 80s and 90s, dropping to a low point in 2007, and beginning to rise again from 2008 to 2015.
QuickStats: Suicide Rates for Teens Aged 15–19 Years, by Sex — United States, 1975–2015. MMWR Morb Mortal Wkly Rep 2017;66:816. DOI: http://dx.doi.org/10.15585/mmwr.mm6630a6
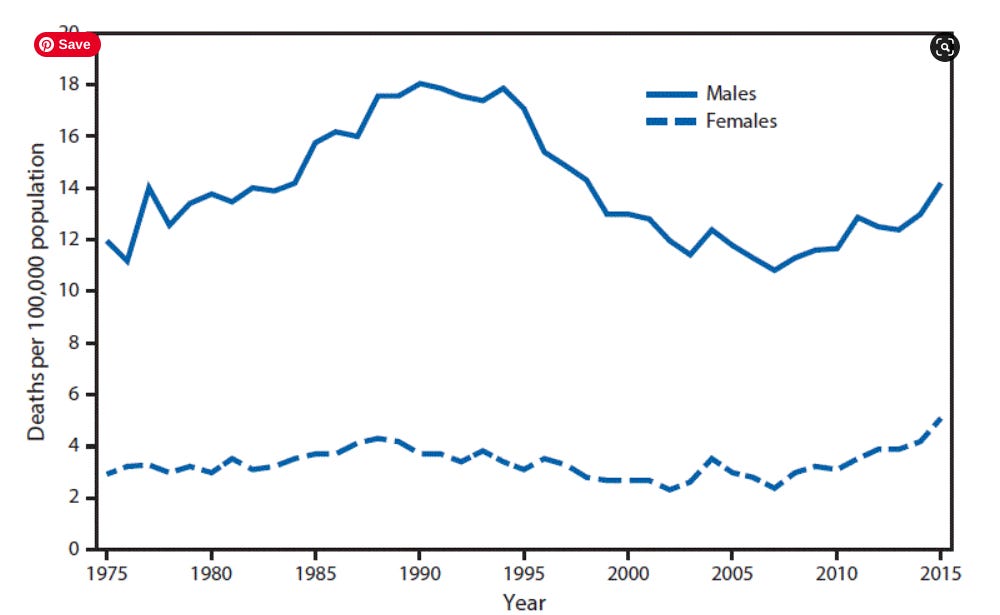
This peak in the 1990s is consistent with some longer term trend data in YBRS. That survey has trends going back to 1991, and indeed, on some measures this is also not the worst things have ever been.
So what are we to make of the recent huge increase in self-reported sadness, a large increase in depression as reported by structured interview, fairly flat or small increases in self-reported suicidal behavior, and a moderate recent increase in suicide rates but an overall drop from previous decades?
First, to be clear in my conclusion, both depression and suicides are increasing among youth since their low points in the late aughts, and any increase is alarming given the seriousness of depression and the tragedy of suicide deaths. The magnitude of the increase depends greatly on which data source you use, and the methodology used to collect that data. Self-report elicits larger increases in distress than structured interview, but both show a clear and significant increase in the number of adolescents experiencing sadness and clinical depression.
Second, while the situation is particularly dire for LGBQ-identified youth, that is not a change from previous periods. Whatever is driving large changes in these self-reported measures, we are seeing a divergence in the trend for LGBQ youth and heterosexual youth. Again, this raises more questions than it answers.
Third, when we look at outcomes (completed suicide) we see that this is not the worst things have ever been, which is consistent with the long term trends shown in YBRS. It seems that there are waves of depression and suicide among youth that wax and wane over time. Indeed, I am sure whatever is causing the current rise in youth distress and suicide is different from the cause in earlier decades, but our reaction as adults is similar - to look at what youth and society are doing wrong and needs to be fixed.
Which is my final point: that none of this data actually tells us anything about the causes of youth distress or its rapid increase. We can line this data up with larger trends in society, but at the end of the day we do not know why youth are struggling so much. Our drive to explain what is behind the trends is a virtue in my mind - we see youth suffering and we want to ease that suffering and make conditions better for them. But we also run the risk of over-correcting if we fail to have a clear way to identify the causal mechanisms behind our takes.